Social Media

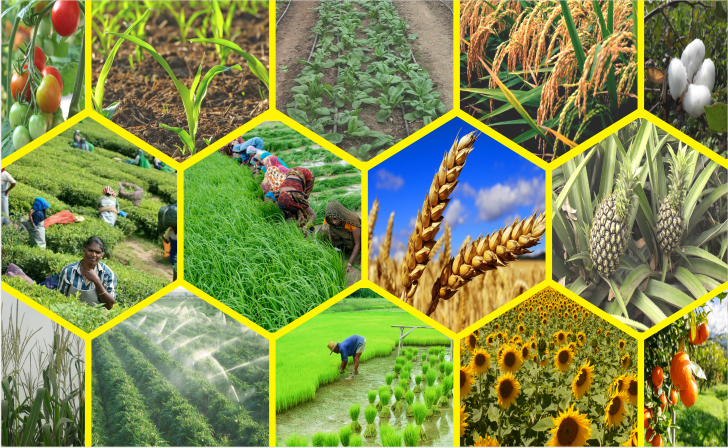
Important Facts Related to Indian Economy: – (Agriculture)

  • Agriculture sector provides livelihood to 65% to 70% of total population. This sector provides employment to 48·9% of country’s workforce and is the single largest private sector occupation.
  • A major new mission has been launched during the 12th Plan is the ‘National Mission for Sustainable Agriculture’ (NMSA).
  • Dryland Agriculture, Risk Management, Access to Information and use of Bio-technology are focus areas of NMSA.
  • NMSA is one of the eight miss-ions under the National Action Plan on Climate Change. The other 7 Missions are :

(i) National Solar    Mission.

(ii) National


2nd Advance Foodgrains Estimates During 2016-17

The 2nd  Advance  Estimates  of production of major crops for 2016-17 have been released by the Department of Agriculture, Cooperation and Farmers Welfare on 15th February, 2017.

As per 2nd Advance Estimates, the estimated production of major crops during 2016-17 is as under :

  •  Foodgrains—271·98 million tonnes (record)

*      Rice–108·86  million tonnes (record)

*      Wheat–96·64 million tonnes (record)

*      Coarse Cereals–44·34 million tonnes (record)

*      Maize–26·15 million tonnes (record)

*      Pulses–22·14 million tonnes (record)

*      Gram–9·12 million tonnes

*      Tur  –  4·23 million tonnes (record)

*      Urad  –  2·89 million tonnes (record)


  •  Oilseeds–33·60  million  tonnes (record)

*      Soyabean–14·13 million tonnes

*      Groundnut–8·47 million tonnes

*      Castorseed–1·74 million tonnes


  •  Cotton–32·51 million bales (of 170 kg each)
  •  Sugarcane–309·98 million tonnes


Minimum Support Prices (Crop Year) of Major Crops (R/Quintal)
Commodity 2015-16 2016-17
Kharif Crops
Paddy (Common) 1410 1470
Paddy (Grade ‘A’) 1450 1510
Jowar (Hybrid) 1570 1625
Jowar ((Maldandi) 1590 1650
Bajra 1275 1330
Ragi 1650 1725
Maize 1325 1365
Tur (Arhar) 4625^ 5050*
Moong 4850^ 5225*
Urad 4625^ 5000*
Groundnut 4030 4220$
Sunflower Seed 3800 3950$
Soyabean (Yellow) 2600 2775$
Sesamum 4700 5000#
Nigerseed 3650 3825$
Cotton
(Medium Staple) 3800 3860
Cotton
(Long Staple) 4100 4160
Rabi Crops
Wheat 1525 1625
Barley 1225 1325
Gram 3425^^ 4000**
Lentil (Masur) 3325^^ 3950##
Rapeseed/Mustard 3350 3700*

Source : Commission for Agricultural Costs and Prices (CACP).

Notes : Figures in brackets indicate percentage increase. ^ : Included Bonus R 200 Per quintal, * : Including Bonus R 425 per quintal, $ : Including Bonus R 100 per quintal, # : Including Bonus R 200 per quintal, ^^ : Additional bonus R 75 per quintal, ** : Including bonus of R 200 per quintal, ## : Including bonus of R 100 per quintal.

Mission for Enhanced Energy Efficiency,

(iii) National Mission for Sustainable Habitat,

(iv) National Water Mission,

(v) National Mission for Sustaining the Himalayan Eco-System,

(vi) National Mission for the Green India,

(vii) National Mission for Strategic knowledge for Climate Change.

  • Agriculture Ministry in its fourth advance   estimates  has   revised  food grain production estimates to 252·68 for the 2014-15 crop year. For 2016-17 (2nd Advance Estimates) food grain production has been estimated at 271·98 million tonnes.
  • The share of agriculture and allied sector  in  the  gross  domestic product  has   registered  a steady decline from 36·4% in 1982-83 to 17·4 per cent in 2015-16 (on the basis of new series base year 2011-12). For 2016-17 (1st Advance Estimates) it has been estimated at 17·0%.
  • As against the growth target of 4%   for   agriculture  and  allied sector in the 12th plan, the growth  registered  in  the   years 2012-13, 2013-14 and 2014-15 stood at 1·2%, 4·2 and (–) 0·2% respectively.  For  2015-16,  it is estimated at 1·2% and for 2016-17 (1st advance estimates) it is placed at 4·1%.
  • Agriculture in our coun­try pro­vides livelihood to about 60% of the population.
  • Agriculture sector pro­vides employment to 58·2% of country’s work force and is the single largest private sector occupation.
  • Green Revolution in the country was actually started in the year 1966-67.
  • Due to Green Revolution, the share  of  wheat  in  the  total production has increased. The share of rice remained constant while the shares of coarse cereals and pulses has reduced.
  • India is 2nd largest producer of fruits and vegetables in the world.
  • Coarse  cereals  include  jawar, maize,  bajra,  ragi  and  small millets.
  • The Cabinet Committee on Economic Affairs (CCEA) has approved the MSPs of Kharif crops  for 2016-17 crop year (July-June). Paddy (common) MSP has  been hiked by   60 to  1,470 per quintal for 2016-17 crop year. Paddy MSP of Grade ‘A’ variety has been also raised  by    60  to   1,510 per quintal.
  • The   Cabinet   Committee  on Economic Affairs (CCEA) has approved the Minimum  Support Prices (MSPs) for Rabi Crops of 2016-17  season  to  be marketed in 2017-18. All the MPS’s are revised   higher   in  the  range of  100 to  400  per  quintal.  The  prices  are  decides  as  per  the recommendations  of  the  Com-mission for Agricultural Costs and Prices (CACP).
  • For the marketing year 2017-18, the MSP of wheat has been fixed at 1625/Quintal. For Barley it is fixed at  1325/Quintal.
  • Nine oilseeds which are produced in India are groundnuts, mustard, toria,  soyabean,   sun­flower, sesamum   (til),   castorseed, nigerseed, linseed and safflower (kardi).
  • Madhya Pradesh has the highest production of soyabean in India.
  • India holds second position after Brazil in the world in the produc-tion of sugarcane and sugar.
  • The Cabinet Committee on Eco-nomic    Affairs    (CCEA)   has
    approved to raise buffer food-grain stocks with the Food Cor-poration of India, to cater to the rising needs of Targeted Public Distribution System (TPDS) due to the implementation of the Food Security Act.
  • The ACP has recommended the government to keep the fair and remunerative price for sugarcane unchanged at  230/Quintal for 2016-17 (October-September).
  • As per revised norms, the FCI will have to keep more grain rice and wheat in July and October, when the grain stocks held with it  would  usually  be  at  higher levels.
  • The revised buffer norm for April 1 is 21·04 million tonnes of wheat and rice as against the present 21·2 million tonnes. For July 1, it is 41·12 million tonnes as against 31·9 million tonnes. On October 1, the stock should be 30·77 million  tonnes  as  against 21·2 million tonnes and on January 1, it should be 21·41 mil-lion tonnes as against 25 million tonnes.  The  buffer  will include  five million tonnes of strategic reserves of wheat and rice.
  • India is world’s biggest producer and consumer of pulses. Initially India banned exports of the pulses in June 2006. It has been extending the ban since then.
  • The growth target for agriculture in 12th plan (2012–17) remains at 4% p.a.
  • West Bengal, Andhra Pradesh, Uttar  Pradesh  and  Punjab  were the top four producers cumula­tively accounting for half  of  the  country’s rice production.
  • India produces 45% of the global production of Cashew. India is the largest producer, processor, consumer and exporter of Cashew in the world.
  • India contributes about 13% to the world vegetable production and occupies first rank in the production of cauliflower, second in Onion and third in Cabbage in the world.
  • India’s share in the world production of mango is about 54%.
  • India occupies the first rank in banana production of 1·16 million tonnes.
  • The present availability of human protein in an Indian diet is 10 gm per person per day as against a world average of 25 gm.
  • Globally   India   is   the   second largest  producer  of  silk  and contributes about 18% to the total world raw silk production.
  • The  livestock  sector contributes over 4 per cent to the total GDP and  about  a  quarter of the GDF from agriculture and allied activities.
  • The    Cabinet    Commit­tee     on   Economic  Affairs  (CCEA)  has approved a proposal to abolish the   levy-sugar    mechanism,     under which private millers have to  sell   a  specified  quantity  of the sweetener to the government at concessional rates.

The CCEA also dismantled the regulated release mechanism, which allows mills to sell only a specified quantity within a fixed time frame.

  • National     Seed    Development Policy was adopted in 1988 which allowed import of seeds of coarse cereals, pulses, vegetables, flowers etc., but stopped the  wheat  and  paddy  seeds import. It is the first time when the government has also allowed the import of wheat and paddy seeds.
  • Animal  husbandry  output constitutes about 30% of the country’s agriculture output.
  • U.P. is the biggest wheat producing state in India. Punjab and Haryana hold second and third positions respectively.
  • Rice is the main food crop in India. The biggest rice producing state is West Bengal. Punjab and Uttar Pradesh hold the  second  and   third places respectively.
  • The    biggest   coarse   cereals producing  area  is Maharashtra. Karnataka and Rajasthan hold the second and third position respectively.
  • The biggest pulses producing state is M. P., Maharashtra and Uttar Pradesh hold the second and third places respectively.
  • Agriculture credit flow target for  2017-18 was fixed at  10,00,000 crore. During 2015-16  8,77,224 crore distributed as credit to agriculture sector, out of which 68·93% was distributed by commercial   banks,   17·48%   by cooperative credit banks, 13·60% by RRBs.
  • For 2016-17 agriculture credit target was fixed at  9 lakh crore. As against target, the achieve-ment for 2016-17 (Upto Septem-ber 2016) was 84 per cent of the target.
  • As per RBI’s guidelines domestic commercial banks/foreign banks with 20 and above branches have to distribute at least 18 per cent of their ANBC or credit Equivalent of off balance sheet expo-sure to agriculture either in the form   of   ‘direct    finance’   or ‘indirect finance’.
  • The distinction between direct and indirect agriculture is dispensed with from April 23, 2015 by the RBI.
  • Union government has approved the Interest Subvention Scheme for farmers for the year 2016-17 on July 5, 2016. The government has earmarked a sum of  18,276 crore for this purpose. The scheme will help farmers to get short-term crop loan payable within one year upto  3 lakh at only 4% per annum.
  • India is the largest producer and consumer of tea in the world and accounts for around 27% of world production and 13% of world trade.
  • Under the present for­eign trade policy, import of tea is permitted with an import duty of 100%.
  • India  contributes  only  4%  of world  coffee  production,  but India ranks sixth in world coffee production.
  • Among plantation crops, coffee has made significant contribution to the Indian economy during the last 50 years.
  • India is the fourth largest pro­ducer of natural rubber (NR) with an 8·2 per cent share in world production in 2010. The small-holding sector accounted for 89 per cent of rubber planted area and 93 per cent of NR production.
  • Karnataka which is the largest producer of coffee in the country accounts for 56·5% of total coffee production in India.
  • Domestic demand for coffee in the country is about 70000 tonnes per annum. 70% of the total coffee production is exported from India.
  • India is the largest producer and consumer of black tea in the world. Tea is grown in 16 states in India. Assam, West Bengal, Tamil Nadu and kerala account for about 96 per cent of the total production.
  • The RKVY, a flagship scheme of the   Government   in   the   agriculture and allied sectors was launched   in   August   2007    to reorient current agricultural development strategies to meet the needs of farmers and reju­venate the agricultural sector so as to achieve 4 per cent annual growth during the Eleventh Five Year Plan.
  • Kerala is the main rubber producing state which produces 90% of   rubber   in   the  country  and accounts for over 85% of the area under cultivation.
  • The   Price   Stabilisation    Fund Scheme (PSFS) for tea, coffee, rubber and tobacco growers was launched in April 2003 against the backdrop of decline in unit value realisation of these commodities, at times falling below their cost of production.
  • India is the largest milk producing country in the world. During 2015-16, milk production was 146·31   million   tonnes   in   the country, thus becoming an important secondary source of income for 70 million rural house-holds engaged in dairying.


States Producing Highest Agriculture Crops
Crop State
Rice West Bengal
Wheat Uttar Pradesh
Maize Andhra Pradesh
Coarse Cereals Maharashtra
Pulses Madhya Pradesh
Total Foodgrain Uttar Pradesh
Grundnut Gujarat
Total Oilseeds Rajasthan
Sugarcane Uttar Pradesh
Cotton Gujarat
Jute/Mesta West Bengal
Potato Uttar Pradesh
Onion Maharashtra


Per capita availability of milk in 1950-51 was 124 gm/day which became 337 gm/day in 2015-16.

  • The country is world’s fifth largest producer of eggs, sixth largest producer of fish and second in inland fisheries.
  • Fisheries constitute about 1% of GDP of the country and 4·75% of agriculture GDP.
  • About 14·4 million people are engaged in fishing, agriculture and    other   allied   activities  of which about 75 per cent are in inland fisheries and the remaining in marine fisheries.
  • Fishing, acquaculture and alllied activities provide livelihood to over 14 million persons and also remained    a    major    foreign exchange earner.
  • Irrigation is one of the six com-ponents for development of rural infrastructure      under     Bharat Nirman.
  • The  Centrally  Sponsored  National Mission on Micro Irrigation (NMMI) was launched in June 2010 in addition to the earlier Micro Irrigation Scheme launched in January 2006. The mission is being implemented during the Eleventh Plan period for enhancing water-use efficiency by adopting drip and sprinkler irrigation systems in all States and Union Territories for both horticulture and agricultural crops.
  • A  scheme  for  the  establishment and maintenance of a Seed Bank has been in operation since 1999-2000.
  • Agricultural Insurance Co. of India Ltd. (AICIL) has intro-duced Rainfall Insurance Scheme known as ‘Varsha Bima’ during 2004  South-West  monsoon period.
  • India is the third highest tobacco producing country in the world. Annual production of tobacco in India is about 5·5 to 6·00 lakh tonnes.
  • Pradhan Mantri Fasal Bima Yojana approved by the Union Cabinet on 13th January, 2016, there  is  a  uniform  premium  of only 2% to be paid by the farmers for all Kharif Crops, 1·5% for all Rabi crops and 5% for commercial and horticulture crops.
  • India ranked first in production of vegetable in the world. Besides India is the second largest producer of fruits in the world.
  • At present  India  is the third largest fertilizer producing country in the world. India meets 94% of  nitrogen     fertilizer     domestic demand and 82% of phosphate fertiliser domestic demand.  For  potash  fertiliser India is totally dependent on imports.
  • Nitrogenous fertilizers accounts about 60% share in total fertiliser consumption  while  share  of pottasic fertilizers is about 12%.
  • Per hectare fertilizer application is quite high in Punjab, Haryana, Andhra Pradesh and Tamil Nadu but  quite  low  in  Rajasthan, Odisha and Madhya Pradesh.
  • National Bamboo Mission is a centrally sponsored scheme with 100%  central  assistance.  The scheme commenced in 2006-07 and   aims  at  holistic  development of the bamboo sector in India.
  • Horticulture crops occupy around 10% of gross cropped area of the country.
  • India accounts for 26·9% of the world’s production  of  horticulture crops.
  • There are 21,221 rural primary periodic agricultural markets, but of which 15% function under the ambit of regulation.
  • The Integrated Scheme of oil- seeds,  pulses,  oil  Palm  and Maize     (ISOPOM) is being implemented in 14 major states for oil seeds and pulses, 15 for maize and 10 for oil palm. the pulses  component  has  been merged with the National Food Security Mission (NFSM) with effect  from  April  1, 2010.
  • Noted Agri.-Scientist Dr. Swaminathan gave a new call for ‘Ever-green Revolution’ for doubling the present production level of foodgrains from 210 million tonnes to 420 million tonnes.
  • Union government has planned to establish Rural Knowledge Centres in various states through NABARD. Initially these centres will  be  established  in  Andhra Pradesh,     Gujarat,    Karnataka, Maharashtra,    Odisha,  Pudu-cherry,  Rajasthan, Tamil Nadu, Uttarakhand   and  West  Bengal.
  • Prime Minister Narendra Modi launched agro e trading platform e-NAM on April 13, 2016. The e-NAM trading mechanism pro-poses to integrate 585 regulated wholesale markets or Agriculture produce Market committee under one electronic platform.

Important Facts Related to Indian Economy: – (National Income)

India’s economic growth slowed marginally to 7% in October-December (2016-17) from 7·4% in Q2, in CSO’s estimate released on February 28, 2017. The data surprised many, including the experts and economists. The Central Statistics Office (CSO)   also   retained   the advanced estimate for 2016-17 at 7·1%, which is lower than 7·9% of 2015-16, but higher than what most economists have predicted in view of the crippling effect that demonetisation has had on consumption and investment. The Q3 GDP growth estimate beat analysts’ expectation of 6·4%. Some had even projected the growth to slip below 6%. Analysts point to flaws in the GDP calculations saying it does not factor in the informal sector, which was the worst hit after the government scrapped  500 and  1,000 notes in a surprise announcement on November 8, 2016.

What has also driven the GDP growth is agriculture sector that grew 6% during October-December as compared to a 2·2% fall in the same quarter of last year and 3·8% in July-September  (2016-17).  During  Q3 (2016-17),  mining  and  quarrying grew by 7·5%, electricity 6·8% and construction    2·7%.    Among     the services sector, the trade, hotels, transport and communication grew by  7·2% while financial sector grew 3·1% and public services 11·9%.

It is worth mentioning here that India’s GDP grew by 7·1% in April-June  (2016-17)  and  7·3%  in July-September (2016-17), making Indian economy among the fastest growing major economies  of  the  world. Eco-nomic Survey 2016-17 lowered economic growth to as low as 6·5% in 2016-17 from 7·9% in 2015-16. How-ever, the Economic Survey : 2016-17 expected that the growth was to  rebound to 6·75-7·50% in 2017-18.

GDP growth rates for 2016-17 and Q1, Q2, Q3 of 2016-17 at constant (2011-12) and current prices are given below :

Growth Rates of GDP

Constant prices (2011-12) Current prices
Annual    2016-17 (Second advance) 7·1 11·5
Q1 2016-17 (April-June) 7·2 10·8
Q2 2016-17 (July-Sept.) 7·4 11·8
Q3 2016-17 (Oct.-Dec.) 7·0 10·6

IInd Advanced Estimates for 2016-17

Key   indicators   of   national income for 2016-17 are given below :

  • Real  GDP  or   Gross   Domestic Product (GDP) at constant (2011-12) prices in the year 2016-17 is likely to attain a level of  121·65 lakh crore, as against the First Revised Estimate of GDP  for  the  year  2015-16  of  113·58 lakh crore. The growth in GDP during 2016-17 is esti-mated at 7·1 per cent as compared to the growth rate of 7·9 per cent in 2015-16.
  • Real   Gross    Value Added, i.e, GVA at basic constant prices (2011-12) is anticipated  to     increase     from    104·70  lakh    crore   in 2015-16 to  111·68 lakh crore in 2016-17. Anticipated growth of real    GVA    at   basic prices in 2016-17 is 6·7 per cent against 7·8 per cent in 2015-16.
  • The sectors which are likely to register growth rate of over 7·0 per cent are ‘public administration, defence and other services’, ‘manufacturing’ and ‘trade, hotels, transport,   communication   and services related to broadcasting’. The growth in the ‘agriculture, forestry and fishing’, ‘mining and quarrying’, ‘electricity, gas, water supply and other utility services’,   ‘construction’   and ‘financial,   real  estate  and  professional services’ is estimated to be 4·4 per cent, 1·3 per cent, 6·6 per cent, 3·1 per cent and 6·5 per cent respectively.
  • The per capita income in real terms (at 2011-12 prices) during 2016-17 is likely to attain a level of  82,112  as  compared  to 77,524 for the year 2015-16. The growth rate in per capita income is estimated at 5·9 per cent during 2016-17, as against 6·6 per cent in the previous year.
  • GDP is derived by adding taxes on products net of subsidies on products to GVA at basic prices. GDP at current prices in the year 2016-17 is likely to attain a level of  152·51 lakh crore, as against   136·75  lakh  crore in 2015-16 showing a growth rate of 11·5 per cent.
  • The Economic Survey 2015-16 had  predicted  the  Indian   economy to register the GDP growth


Second Advance Estimates of GVA at Basic Price by      Economic Activity

(At 2011-12 prices)

( crore)


Industry

2015-16 2016-17 Percentage change over previous year
(1st RE) (2nd AE) 2015-16 2016-17
1.   Agriculture, forestry& fishing 16,16,461 16,87,064 0·8 4·4
2.   Mining & quarrying 3,44,972 3,49,351 12·3 1·3
3.   Manufacturing 18,63,835 20,07,564 10·6 7·7
4.   Electricity, gas, water supply & other utility services 2,24,323 2,39,203 5·1 6·6
5.   Construction 8,52,821 8,79,525 2·8 3·1
6.   Trade, hotels, transport, communication and services related to broadcasting 19,88,512 21,33,851 10·7 7·3
7.   Financial, real estate & professional services 22,94,193 24,43,633 10·8 6·5
8.   Public administration, defence and other services 12,84,603 14,28,124 6·9 11·2
GVA at Basic Price 1,04,69,720 1,11,68,315 7·8 6·7


Second Advance Estimates of GVA at Basic Price by      Economic Activity

(At current prices)

( crore)


Industry

2015-16 2016-17 Percentage change over previous year
(1st RE) (2nd AE) 2015-16 2016-17
1.   Agriculture, forestry& fishing 21,72,910 23,82,289 5·1 9·6
2.   Mining & quarrying 2,96,041 3,09,178 – 5·7 4·4
3.   Manufacturing 20,65,093 22,78,149 9·6 10·3
4.   Electricity, gas, water supply & other utility services 3,21,765 3,38,396 15·1 5·2
5.   Construction 10,00,459 10,64,068 2·3 6·4
6.   Trade, hotels, transport, communication and services related to broadcasting 22,94,367 25,38,162 9·5 10·6
7.   Financial, real estate & professional services 26,32,432 28,96,300 11·4 10·0
8.   Public administration, defence and other services 16,68,871 19,44,243 12·1 16·5
GVA at Basic Price 1,24,51,938 1,37,50,786 8·6 10·4
RE : Revised Estimates, AE : Advance Estimates.


rate in the range of 7 to 7·75 per cent in the year 2016-17. The economy was indeed treading along that path and clocked 7·2 per cent in the first half of 2016-17.

  • As per the first advance estimates of the CSO, growth rate of the services sector is projected to grow at 8·8 per cent in 2016-17, almost the same as in 2015-16.
  • The nominal Net National Income (NNI), also known as national income (at current prices) is likely to be  134·86 lakh crore during 2016-17, as against  120·83 lakh crore for the year  2015-16. In terms of growth rates, the national income registered a growth rate of 11·6 per cent in 2016-17 as against the previous year’s growth rate of 10·2 per cent.
  • The  per  capita  net  national income during 2016-17 is esti-mated to be  1,03,818 showing a rise of 10·2 per cent as com-pared to  94,178 during 2015-16 with the growth rate of 8·9 per cent.
  • India’s economic growth decelerated to its slowest level in six quarters in the April-June period of current financial year 2016-17 against government’s target of achieving 8% growth this year. However, an imminent boost from the agriculture sector on account of a normal monsoon after two consecutive drought years   and   a   push   to   urban consumption from the pay hike to central government employees are expected to significantly push economic growth in the rema-ining quarters of 2016-17.
  • Data released by the Central Statistics Office (CSO)  showed   Gross Domestic Product (GDP) grew 7.1% in the first quarter of the fiscal year, against 7.9% in the preceding three months i.e. the fourth quarter of 2015-16.   During   the June quarter last fiscal 2015-16, GDP growth was estimated at 7.5%.
  • The   Central   Statistics   Office    (CSO), Ministry of Statistics and Programme Implementation has released the estimates of Gross Domestic Product (GDP) for the First Quarter (April-June) Q1,   of 2016-17,    both    at   constant (2011-12)   and   current   prices, along    with   the   corresponding quarterly estimates of expenditure components of the GDP. As per data released by the Central Statistics  Office  (CSO),  GDP growth (measured in terms of constant 2011-12 market prices) for  the  First  Quarter  (Q1)  of 2016-17 is estimated to be 7.1 per cent as against 7.5 per cent for  Q1  of  2015-16.  Growth  of GDP for the full year 2015-16 was estimated to be 7.6 per cent.
  • The growth in agriculture and allied sectors is estimated at 1.8 per cent in Q1 2016-17, as against 2.6  per  cent  in  Q1  2015-16. According to the released data, the manufacturing has registered a   good   recovery   where    the growth increased from 7.3 per cent in Q1 2015-16 to 9.1 per cent in Q1 2016-17. But, on account   of   the   slackness   in mining and quarrying (contraction   of   0.4   per   cent   in   Q1 2016-17) and in construction activity (growth of only 1.5 per cent),   the   overall    industrial growth declined from 6.7 per cent in Q1 2015-16 to 6.0 per cent in Q1 of 2016-17.
  • The growth in services increased from 8.8 per cent in Q1 2015-16 to 9.6 per cent in Q1 2016-17. The official sources state that the major change contributing to this increase in growth is the substantial increase in the growth of public  administration,  defence and other services from 5.9 per cent in Q1 2015-16 to 12.3 per cent in Q1 2016-17. The growth in financial, insurance, real estate and  professional    services  also remained strong during the first quarter of the year 2016-17.
  • The  lower  growth  in  Q1 of 2016-17, compared to Q1 of 2015-16   is attributable to increase in subsidies by 53 per cent which    has   resulted   in   lower growth of net indirect taxes. It is also due to the negative growth in gross fixed capital formation. GFCF growth at constant prices declined from 7.1 per cent in Q1 of 2015-16 to (-) 3.1 per cent in Q1  2016-17.  The  ratio  of fixed capital formation (which is also called fixed investment) to GDP at current prices declined from 31.6 per cent in Q1 2015-16 to 28.3 per cent in Q1 2016-17.
  • According to official sources, the growth in governmental final consumption expenditure, in real terms, increased to 18.8 per cent in Q1 2016-17 from (-) 0.2 per cent in Q1 2015-16. The growth of   private   final   consumption (major component of GDP) has remained more or less the same (6.7 per cent in Q1 2016-17 as against 6.9 per cent in Q1 2015-16, in real terms). The data also reveal that there has been an improvement in the growth of export of goods and services from (-) 5.7 per cent in Q1 2015-16 to 3.2 per cent in Q1 2016-17, as well as, a reduction in the growth of imports from (-) 2.4 per cent in Q1 2015-16 to (-) 5.8 per cent in Q1 2016-17.
  • Growth of GVA at basic prices increased   marginally   from  7.2 per cent in Q1 2015-16 to 7.3 per cent in Q1 of 2016-17. GVA growth is higher than the GDP growth because the growth in net indirect taxes declined from 11.9 per cent in Q1 2015-16 to 3.6 per cent in Q1 2016-17.


The salient features of provisional estimates of the year 2015-16 are as follows :

(a) Estimates at Constant (2011-12) Prices

(i)   Real GDP or GDP at constant (2011-12)   prices   for  the   year

 Growth Rates of GDP

  Constant Prices (2011-12) Current Prices
Annual 2015 -16 7·6 8.7
Q1 2015-16 (April-June) 7·5 8·8
Q2 2015-16 (July-September) 7·6 6·4
Q3 2015-16 (October-December) 7·2 9·1
Q4 2015-16 (January-March) 7·9 10·4


 Provisional Estimates of GVA by Economic Activity


Industry

Percentage
Change Over Previous Year
(At Current Price)
Percentage Change Over Previous Year
(At Basic Price)
2014-15 2015-16 2014-15 2015-16
1.    Agriculture, forestry & fishing 4·9 4·9 – 0·2 1·2
2.    Mining & quarrying 2·8 4·7 10·8 7·4
3.    Manufacturing 7·6 8·1 5·5 9·3
4.    Electricity, gas, water supply & other utility services 12·9 10·8 8·0 6·6
5.    Construction 7·8 1·3 4·4 3·9
6.    Trade, hotels, transport, communication and services related to broadcasting 13·3 6·6 9·8 9·0
7.    Financial, real estate & professional services 13·3 7·4 10·6 10·3
8.    Public Administration, defence and other services 17·3 12·1 10·7 6·6
       GVA at Basic Price 10·5 7·0 7·1 7·2
 NS: New Series Estimates; RE: Revised Estimates; PE: Provisional Estimates


2015-16 is estimated at  113·50 lakh crore, showing a growth rate of 7·6 per cent over the First Revised Estimates of GDP for the year 2014-15 of  105·52 lakh crore.

(ii)   Real GVA, i.e., GVA at basic constant (2011-12) prices for the year 2015-16 is estimated at        104·27 lakh crore, showing a growth rate of 7·2 per cent over the First Revised Estimates of GVA for the year 2014-15 of 97·27 lakh crore.

(iii) The   Gross   National   Income (GNI) at 2011-12 prices is estimated at  112·13 lakh crore during 2015-16, as against the previous year’s First Revised Estimate of  104·28 lakh crore. In terms of growth rates, the gross national income is estimated to have risen by 7·5 per cent during 2015-16, in comparison to the growth rate of 7·3 per cent in 2014-15.

(iv) The  per  capita  income  in  real terms (at 2011-12 prices) during 2015-16 is likely to attain a level of      77435   as   compared   to  72,889 for the year 2014-15. The  growth  rate  in  per  capita income is estimated at 6·2 per cent during 2015-16, as against 5·8 per cent in the previous year.

(b) Estimates at Current Prices

(i)   GDP at current prices for the year   2015-16   is   estimated   at  135·76 lakh crore, showing a growth rate of 8·7 per cent over the First Revised Estimates of GDP  for  the  year  2014-15  of  124·88 lakh crore.

(ii)   The GNI at current prices is estimated at  134·19 lakh crore during   2015-16,   as   compared  to 123·41   lakh   crore    during 2014-15, showing a rise of 8·7 per cent.

(iii) The per capita income at current prices  during  2015-16  is  estimated to have attained a level of  93,293 as compared to the First Revised Estimate for the year 2014-15 of  86,879 showing a rise of 7·4 per cent.

GDP Deflators

The CPI and WPI are proxy measures for inflation. But for the economy as a whole, GDP deflators whether at market prices or factor costs are more appropriate measures of the inflation in goods and services produced. These alternate measures match WPI but diverge somewhat from CPI-IW. In the case of CPI-IW, moderation in inflation in Q2 of 2009-10 is insignificant, largely because food     inflation    remained     elevated during this period.

International Day of Yoga 2017

  8

Yoga is an ancient physical, mental and spiritual practice that originated in India; aims to transform both body and mind; is now practiced in various forms around the world and continues to grow in popularity. Looking at this increasing popularity of yoga, India’s Prime Minister Narendra Modi suggested at the United Nations General Assembly (UNGA)  that yoga be given a special day as it is beneficial for everyone and making it a world event would help in spreading awareness about benefits of practicing yoga. Recognizing its universal appeal, on 11 December 2014, by resolution 69/131, the United Nations proclaimed 21 June as the International Day of Yoga. Since then, millions of people have been holding yoga programmes across the world on this day.

Yoga not only keeps you fit but also has a lot of long-term benefits when you make it an integral part of your lifestyle.

 Yoga is a discipline to improve or develop one’s inherent power in a balanced manner. It offers the means to attain complete self-realization. The literal meaning of the Sanskrit word Yoga is ’Yoke’ and means to join or to unite, symbolizing the union of body and consciousness. Yoga can therefore be defined as a means of uniting the individual spirit with the universal spirit of God. According to Maharishi Patanjali, Yoga is the suppression of modifications of the mind.

The concepts and practices of Yoga originated in India about several thousand years ago. Its founders were great Saints and Sages. The great Yogis presented rational interpretation of their experiences of Yoga and brought about a practical and scientifically sound method within every one’s reach. Yoga today, is no longer restricted to hermits, saints, and sages; it has entered into our everyday lives and has aroused a worldwide awakening and acceptance in the last few decades. The science of Yoga and its techniques have now been reoriented to suit modern sociological needs and lifestyles. Experts of various branches of medicine including modern medical sciences are realizing the role of these techniques in the prevention and mitigation of diseases and promotion of health.

Yoga is one of the six systems of Vedic philosophy. Maharishi Patanjali, rightly called “The Father of Yoga” compiled and refined various aspects of Yoga systematically in his “Yoga Sutras” (aphorisms). He advocated the eight folds path of Yoga, popularly known as “Ashtanga Yoga” for all-round development of human beings. They are: Yama, Niyama, Asana, Pranayama, Pratyahara, Dharana, Dhyana and Samadhi. These components advocate certain restraints and observances, physical discipline, breath regulations, restraining the sense organs, contemplation, meditation and Samadhi. These steps are believed to have a potential for improvement of physical health by enhancing circulation of oxygenated blood in the body, retraining the sense organs thereby inducing tranquility and serenity of mind. The practice of Yoga prevents psychosomatic disorders and improves an individual’s resistance and ability to endure stressful situations.

 Salient Features of Yoga:

Yoga a universal practical discipline: Yoga is universal in character for practice and application irrespective of culture, nationality, race, caste, creed, sex, age and physical condition. Sadhana, the regular practice, creates a pattern in body and mind to uplift them. With practice one can experience the utility of Yogic techniques and realize of its inherent potential of Yoga. It requires keen desire on the part of the practitioner to experience the higher states of consciousness through training the mind and refining the gross consciousness to become an accomplished Yogi.

Yoga is an evolutionary process: in the development of human consciousness. Evolution of total consciousness begins in a particular person only if one chooses it. The vices like use of alcohol and drugs, working exhaustively, indulging too much in sex and other stimulation is to seek oblivion, a return to unconsciousness. Indian yogis begin from the point where western psychology end. If Fraud’s psychology (Why good people do bad things) is the psychology of disease and Maslow’s psychology is the psychology of the healthy man then Indian psychology is the psychology of enlightenment. In Yoga, it is not a question of psychology of man rather it is a question of higher consciousness. It is not also the question of mental health; rather, it is question of spiritual growth.

 Yoga as soul therapy: All paths of Yoga (Japa, Karma, Bhakti etc.) have healing potential to shelter out the effects of pains. However, one especially needs proper guidance from an accomplished exponent, who has already treaded the same track to reach the ultimate goal. The particular path is to be chosen very cautiously in view of his aptitude either with the help of a competent counselor or consulting an accomplished Yogi.

Types of Yoga:

 Japa Yoga: To concentrate one’s mind on divine name or holy syllable, mantra etc. like ’OM’, ‘Rama’, ’Allah’, ’God’, ’Vahe Guru’ etc. through repeated recitation or remembrance.


Karma Yoga: Teaches us to perform all actions without having any desire for their fruit. In this sadhana, a Yogi considers his duty as divine action, perform it with whole-hearted dedication but shuns away all desires.


Gyana Yoga: Teaches us to discriminate between self and non-self and to acquire the knowledge of one’s spiritual entity through the study of scriptures, company of Saints and practices of meditation.

Bhakti Yoga: Bhakti Yoga, a system of intense devotion with emphasis on complete surrender to divine will. The true follower of Bhakti Yoga is free from egoism remains humble and unaffected by the dualities of the world.


Raja Yoga: Raja Yoga popularly known as “Ashtanga Yoga” is for all-round development of human beings. These are Yama, Niyama, Asana, Pranayama, Pratyahara, Dharana, Dhyana and Samadhi.


Swara Yoga: Swara Yoga is the Science which is about the realization of cosmic consciousness, through the awareness/ observation then control/ manipulation of the flow of breath in the nostrils. Swara Yoga involves the systematic study of the breath flowing through the nostril (or Swara) in relation to the prevailing phases of the Sun, Moon, time of day and direction. It is the association of the breath in relation to the activities or phases or positions of the Sun, Moon, Planets, Seasons, Time of day, with the physical and mental conditions of the individual and then taking the appropriate action according to these subtle relations.


Kundalini:  Yoga is a part of Tantric Tradition. Since the dawn of creation, the Tantrics and yogis have realized that in this physical body, there is a potential force residing in Muladhara Chakra, the first of seven Chakras. The seat of Kundalini is a small gland at the base of the spinal cord. In the masculine body it is in the perineum between the urinary and excretory organs. In the female body its location is at the root of the uterus in the cervix. Those people who have awakened this supernatural force have been called Rishis, Prophets, Yogis, Siddhas and other names according to the time, tradition and culture. To awaken the Kundalini, you must prepare yourself through yogic techniques such as Shatkriya, Asana, Pranayama, Bandha, Mudra and Meditation. Awakening of Kundalini results in an explosion in the brain as the dormant or sleeping areas start blossoming like flowers.

Nadi: As described by Yogic texts, Nadis are flow of energy which we can visualize at the psychic level as having distinct channels, light, colour, sound and other characteristics. The entire network of nadis is so vast that even yogic texts differ in their calculations of the exact number. Reference in the Goraksha Sataka or Goraksh Samhita and Hatha Yoga Pradipika place their number at 72,000; emerged from the navel center- the Manipuri Chakra. Of all the thousands of nadis, Susumna is said to be the most important. The Shiva Swarodaya enumerates ten major nadis which connect to the ‘doorways’ leading in and out of the body. Of these ten, Ida, Pingala and Sushumna are the most important, they are the high voltage wires which conduct the energy to the substations or Chakras situated along the spinal column.

Yoga for Health

The theme for the 2017 celebration, organized by the Permanent Mission of India to the United Nations, is ‘Yoga for Health.’ The theme highlights the fact that yoga can contribute in a holistic way to achieving equilibrium between mind and body. The organizers believe that this approach to health and wellbeing can make a direct and useful contribution to humankind’s quest to achieve sustainable development and move towards lifestyles that are in harmony with nature.

The third International Yoga Day 2017 was celebrated in nearly 180 nations with much fervor.  United Nations Headquarters was lit up with images of yoga postures. It was celebrated from China’s Great Wall to Britain’s London Eye. Yoga enthusiasts performed ‘asanas’ at iconic landmarks as several events were held in various countries to mark the event. In China, a large number of Chinese yoga enthusiasts participated in a colorful yoga event at Great Wall on the eve of the International Yoga Day. In the UK, yoga enthusiasts have been participating in mega yoga events this week at iconic tourist attractions such as the London Eye and Trafalgar Square to celebrate the third International Day of Yoga. In the US, a large number of people including from the Indian community participated in special yoga sessions organized by the Indian Consulate to commemorate the third International Yoga Day.

Prime Minister Narendra Modi led the celebrations for the event at the Ramabai Ambedkar Maidan in Lucknow. Several schools, colleges and offices, across all states organized events to encourage people from all walks to life to include yoga in their daily routine. Over the last few months, PM Modi had been posting videos on his twitter account about several asanas that are good for the mind and body and has recommended following for the International Yoga Day 2017:

  1. Vajrasana, Sitali Pranayam 
  2. Nadi Shodhan Pranayama
  3. Shashankasana
  4. Setu Bandhasana
  5. Ardha Halasana
  6. Uttanpadasana
  7. Bhujangasana
  8. Shalabasana
  9. Pawanmuktasana

The Ministry of AYUSH (Ayurveda, Yoga & Naturopathy, Unani, Siddha and Homoepathy),   released a day before  the International Yoga Day, the new ‘Common Yoga Protocol’ booklet, that has a wealth of information about the history of yoga, its benefits and step-by-step instructions, with sketches on specific ‘asanas’. Here’s a handy list of top 10 ‘dos’ ‘don’ts’ as prescribed by the ministry’s Yoga Protocol:

  • Keep surroundings, body and mind clean
  • Practice on an empty or light stomach
  • Wear light and comfortable cotton clothes
  • Start practice sessions with a prayer
  • Perform ‘asanas’ slowly
  • Be aware of your body and breathing, hold breath only when specified
  • Always breathe through the nostrils unless specified
  • End yoga session should be with meditation, deep silence
  • Bathe only 20-30 minutes after yoga session
  • Eat only 20-30 minutes after yoga practice

The International Day of Yoga event held at Ahmedabad’s GMDC ground entered the Guinness World Records book with over 54,000 persons, led by Yoga guru Ramdev, participating in it to perform various asanas. Gujarat chief minister Vijay Rupani received the certificate of the record from the Guinness Book officials at Gandhinagar in the afternoon. The previous record was set in Delhi on June 21, 2015, when 35,985 people performed yoga at Rajpath with Prime Minister Narendra Modi. Twenty-two other records, such as the maximum number of Surya Namaskars by one person, were also set during this event and certified by the Guinness Book officials.

Yoga is positioned as India’s “gift to the world”, packaged as a means to achieve equality of the mind with the outside world, as well as equality between people. Yoga symbolized the union of humanity and India shares it with the world in an open and inclusive way. Prime Minister Narendra Modi called it a people’s movement, highlighting that it could be practiced by atheists and believers and focused on how it is inexpensive. At zero budgets, nowhere in the world is one assured of health, but that is what yoga gives you. Even the poorest of the poor can do this at ease and keep themselves healthy.

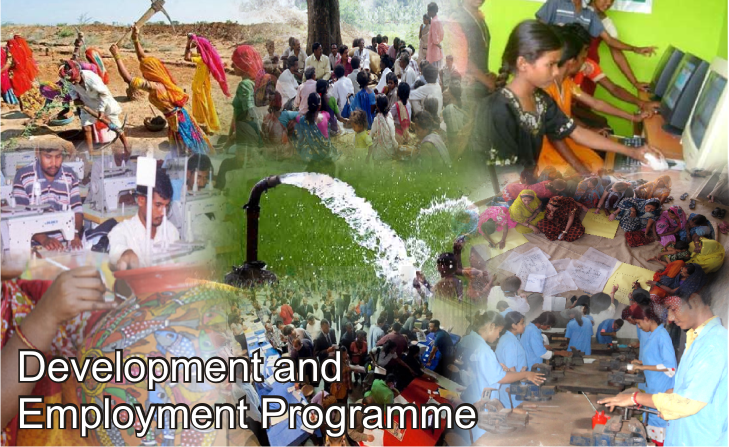
Indian Economy A Few Facts: At A Glance (DEVELOPMENT AND EMPLOYMENT PROGRAMME)

Beginning of Jawahar Rojgar Yojana (JRY)  1-Apr-89
Beginning of Employment Assurance Scheme (EAS) 2-Oct-93
Percentage of Wage Factor in Total Expenditure under JRY 60%
Beginning Year of IRDP 1978-79
Minimum Percentage of SC/ST People in Target Group of IRDP 50%
Head Office of CAPART New Delhi
Beginning of Nehru Rojgar Yojana (NRY) Oct. 1989 Beginning of Swaran Jayanti Shahari Rojgar Yojana (SJSRY) 1-Dec-97
Annapurna Yojana 19-Mar-99
Beginning of Swaran Jayanti Gram Swarojgar Yojana 1-Apr-99
Jan Shree Bima Yojana 10-Aug-00
Beginning of Antyodaya Anna Yojana Dec. 25, 2000
Beginning of Sampurna Gramin   


Branches of Scheduled Commercial Banks

(As on September 30, 2016)

Banks Total Rural %
(i)    SBI and Associates 23742 7706 32·46
(ii)   Nationalised Banks 64454 20479 31·77
(iii)  Other Public Sector Banks 2046 417 20·38
(iv)  Private Sector Banks 23315 4167 17·87
(v)   Foreign Banks 317 8 2·52
(vi)  Regional Rural Banks 20877 14961 71·66
(vii) Local Area Banks 70 9 12·86
(viii) Small Finance Banks 63 28 44·44
(ix)  Total Branches 134884 47775 35·42
        (A) Rural Branches 47775 35·42%
        (B) Semi-Urban 37365 22·70%
        (C) Urban 23946 17·75%
        (D) Metropolitan 25798 19·13%


Rojgar Yojana Sept. 25, 2001
Beginning of Pradhan Mantri Gram Sadak Yojana Dec. 25, 2001
Social Security Scheme for Labours of Unorganised Sector 23-Jan-04
National Food for Work Programme Nov. 14, 2004 National Rural Employment  Guarantee Programme 2-Feb-06
Aam   Aadmi   Bima Yojana August 31, 2007 National Rural Livelihood Mission Jun-11
National Urban Livelihood Mission 2013-14
Pradhan  Mantri Jan Dhan Yojana 28-Aug-14
Make in India Campaign 25-Sep-14
Pt. Deendayal Upadhyay Antyodaya Yojana 25-Sep-14
Clean India Campaign 2-Oct-14
Pt. Deendyal Upadhyay Shramev Jayate Programme 16-Oct-14
National Mission on Pilgrimage Rejuvenation and Spiritual Augmentation Drive (PRASAD) 2014-15
National Heritage Development and Augmentation Yojana 21-Jan-15
Sukanya Samriddhi Yojana 22-Jan-15
Beti Bachao Beti Padhao Campaign 22-Jan-15
Pradhan Mantri Kaushal Vikas Yojana : 2015-16 HriDAY : 2015-16 Atal Pension Yojana : 2015-16

Indian Economy A Few Facts: At A Glance (MONETARY AND CREDIT POLICY)

(Status as on April 6, 2017)  
Bank Rate 6·50%
Marginal Standing Facility Rate 6·50%
Cash Reserve Ratio (CRR) 4·0%
Statutory Liquidity Ratio (SLR) (7.2.17) 20·50%
Repo Rate 6·25%
Reverse Repo Rate 6·00%
External Debt (End-December 2016)  
Total External Debt $ 456·066 billion
Long-term External Debt $ 372·245 billion (81·6% of total debt)
Short-term External Debt $ 83·821 billion (18·4% of total debt)


India’s Key External Debt Indicators

(Status at end-December 2016)

1.   External debt to GDP (2015-16) 23·5%
2.   Debt Service Ratio 8·8%
3.   Concessional Debt to Total Debt 9·2%
4.   Foreign Exchange Reserves to Total Debt 78·7%
5.   Short-term External Debt to Foreign Exchange Reserves 23·4%
6.   Short-term External Debt to Total Debt 18·4%


Currency Composition of External Debt

(At end-December 2016)

                                                                                                                                (% share)

1.   US Dollar 54·7
2.   Indian Rupee 31·1
3.   Japanese Yen 4·4
4.   SDR 5·9
5.   Euro 2·7
6.   Sterling Pound

7.   Others

0·7

0·5


Banking in India (1st March, 2017)  
Public Sector Banks  
SBI and its Associate 6
Nationalised 19
IDBI Bank 1
Bhartiya Mahila Bank 1
Regional Rural Banks 56
Private Sector Banks  
Old Private Banks 13
New Private Bank 9
Payments Banks 2
Small Finance Banks 3
Foreign Banks Operating in India 43


  Cooperative Credit Institutions in India (As at end of March 2016)  
(A) Rural Co-operatives (Short-Term Credit)  
* State Co-operative Banks 32
* District Central Co-operative Banks 370
* Primary Agricultural Credit Societies 93042
(B) Rural Co-operatives (Long-Term Credit)  
* State Co-operative Agriculture and Rural Development Banks 20
* Primary Co-operative Agriculture and Rural Development Societies 714
(C) Urban Co-operative Banks  
* Scheduled Urban Co-operative Banks 50
* Non-Scheduled Urban Co-operative Banks 1529


Development Banks  
  • NABARD
Estd.—July 12, 1982; HQ—Mumbai
  • NHB
Estd.—July 1988; HQ—New Delhi
  • SIDBI
Estd.—April 2, 1990; HQ—Lucknow
  • EXIM Bank
Estd.—Jan. 1, 1982; HQ—Mumbai


Foreign Direct Investment  
Cumulative FDI inflows (April 2000-December 2016) (Including re-invested earnings & other capital) US $ 472·199 billion
Cumulative Portfolio Foreign Investment (April 2000-December 2016) $ 183·697 billion
FDI inflows 2015-16 US $ 55·457
FDI inflow (April-December 2016) US $ 48·032 billion
FDI Equity Inflow (2015-16) $ 40·001 billion
Maximum FDI inflow from (Country) Mauritius (34·0%)  
Maximum FDI inflow in (Sector) Services Sector (18·0%) followed by construction (8·0%) Telecommunication (7·0%)  
Maximum FDI inflow in (State/Region) RBI’s Mumbai Regional Office (31%)  
[(Maharashtra, Dadra & Nagar Haveli, Daman & Diu) followed by NCR Delhi (21%) and Chennai (7%)]  
Indian Banking Sector  
Central Bank Reserve Bank of India (Estd.  1935;  Nationalised–1949; HQ–Mumbai; Governor–Raghuram Rajan)
First Nationalisation of Commercial Banks 14 (July 19, 1969)
Second Nationalisation of Commercial Banks 6 (April 1980)
Gross Domestic Saving Rate Eleventh Plan (2007–12) Twelfth Plan (2012–17) 33·6%
Investment Rate  Eleventh Plan (2007–12) 38·2%
Twelfth Plan (2012–17) 38·8%

Indian Economy A Few Facts: At A Glance (TRANSPORT)

Total Rail Route (March 31, 2016) 66,687 km
Electrified Rail Route (March 31, 2016) (42% of  total)
Percentage of passenger traffic operated on electric traction (Approximate) 50·5%
Percentage of freight traffic operated on electric traction (Approximate) 65·2%
Rail operating ratio 2015-16 90·5%
Rail operating ratio 2016-17 (R.E.) 94·6%
Rail operating ratio 2017-18) (B.E.) 94·6%
Asia’s First and World’s Second largest Rail System Indian Railways
Largest Railway Zone Northern Railway
Total Road Network 52·32 lakh km
Total Length of National Highways/Expressways (March 2016) 103933 km
Total Length of State Highways 161487 km
Total Length of Other Roads 5207044 km
State with Highest Road Length Maharashtra (608140 km)
Number of Major Ports 13
Number of Non-Major Ports 200

Indian Economy A Few Facts: At A Glance (FOREIGN TRADE)

  2015-16 2016-17
Exports 261·14 274·645
Imports 379·50 380·368
Trade Balance – 118·46 105·723


Establishment of First Trade Point in India New Delhi (August 16, 1994)
Commodity with Highest Share in Total Export Value (2015-16) Gems and Jewellery 15·08%
Country with Highest Foreign Trade with India (2015-16) China
% Share of Indian exports in total world exports (2015) 1·62%
India’s share in world imports (2015) 2·3%
WTO Profile India (2015) :  
Merchandise Export (f.o.b.) $ 267·147 billion
Merchandise Import (c.i.f.) $ 395·977 billion


Rank in World Trade    
-2015 Exports Imports
Merchandise 19th 13th
Commercial Services 8th 10th
Trade in Commercial  Services $ 155·288 billion $ 122·225 billion

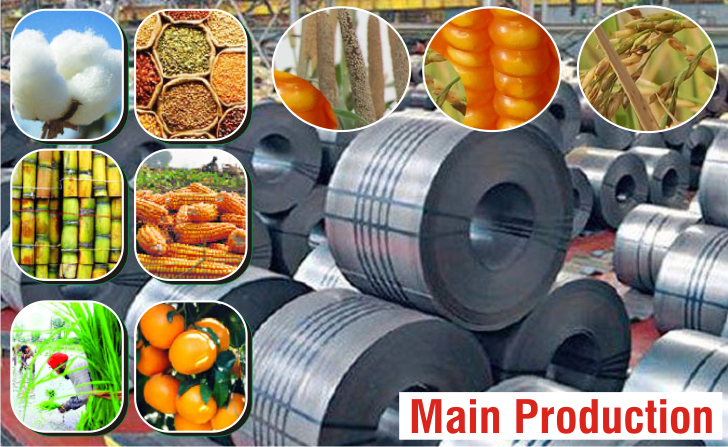
Indian Economy A Few Facts: At A Glance (MAIN PRODUCTION)

Foodgrains (2014-15) 252·02 million tonnes
Foodgrains  
2015-16 251·57 million tonnes
2016-17 (IInd AE) 271·98 million tonnes
Raw Steel (2014-15) 86·5 million tonnes
Production of Selected Commodities (2015-16) :  
Coal Reserves 306·60 billion tonnes
Lignite Reserves 43·25 billion tonnes
Coal Production 637·87 million tonnes
Lignite Production 44·44 million tonnes
Cement Production 285·83 million tonnes
Fertilizer’s Production  
Urea 24·461 million tonnes
DAP 3·822 million tonnes
Mixed (Other than DAP) 8·379 million tonnes
SSP 4·355 million tonnes
Crude Oil 36·95 million tonnes
Refining Capacity 230·66 million tonnes per annum 4·62 million tonnes per day
Refinery Throughpul 231·92 million tonnes
Natural Gas 32·00 billion cubic meter
Total Vehicles 23,960,940
Passenger Vehicles 34,13,959
Commercial Vehicles 7,82,814
Three Wheeler 9,33,950
Two Wheeler 1,88,29,786
Power Generation-installed Capacity (2016-17) : 315426·32 MW
Thermal Power 215214·89 MW
Coal Based 189047·88 MW
Gas Based 25329·38 MW
Diesel Based 837·63 MW
Nuclear Power 5780·00 MW
Hydro Power 44413·43 MW
Renewable Energy Source 50018·00 MW
Power Generation (April-February 2017) : 1057·74 billion kwh
Thermal Power 903·693 billion kwh
Hydro Power 114·330 billion kwh
Nuclear Power 34·136 billion kwh
Bhutan Import 4·859 billion kwh


Agriculture Production

(Million Tonnes)

  2014-15 2015-16 2016-17 (IInd AE)
Total Foodgrains 252·02 251·57 271·98
Total Pulses 17·33 20·75 22·14
Total Oilseeds 27·51 25·25 33·60
Rice 105·48 104·41 108·88
Wheat 86·53 92·29 96·64
Coarse Cereals


Minimum Support Prices for Rabi Crops of 2016-17 Season to be Marketed in 2017-18

( per quintal)

Commodity MSP for 2017-18 Season
Wheat 1625
Barley 1325
Gram 4000
Masur (Lentil) 3950
Rapeseed/Mustard 3700


Minimum Support Prices for Kharif Crops
for 2016-17 Season

( per quintal)

Commodity

Variety

MSP for 2016-17 Season
Paddy Common 1470
  Grade A 1510
Jowar Hybrid 1625
  Maldandi 1650
Bajra 1330
Maize 1365
Ragi 1725
Tur (Arhar) 5050
Moong 5225
Urad 5000
Groundnut in-shell 4220
Soyabean Yellow 2775
Sunflower Seed 3950
Sesamum 5000
Nigerseed 3825
Cotton Medium Staple 3860
  Long Staple 4160

Indian Economy A Few Facts: At A Glance (ANNUAL RATE OF GROWTH OF GDP)

(At constant prices)  
First Plan (1951–56) 3·6%
Second Plan (1956–61) 4·1%
Third Plan (1961–66) 2·5%
Three Annual Plan (1966–69) 3·8%
Fourth Plan (1969–74) 3·3%
Fifth Plan (1974–78) 5·0%
Annual Plan (1979-80) 6·0%
Sixth Plan (1980–85) 5·4%
Seventh Plan (1985–90) 5·8%
Annual Plan (1990–92) 3·0%
Eighth Plan (1992–97) 6·7%
Ninth Plan (1997–2002) 5·5%
Tenth Plan (2002–07)    Target 8·0%
Achieved 7·8%
Eleventh Plan (2007–12) Target (Original) 9%
Target (Revised) 8·1%
Achieved 7·9%
12th Plan (2012–17)   Target 8·0%