Social Media

Indian Economy A Few Facts: At A Glance (ECONOMIC INDICATORS)

Index of Industrial Production (2016-17) (December 2016) 183·5
Share of Industrial Sector in GVA  (Average Ratio for 2011-12 to 2014-15) 31·8%
Index of Agricultural Production (2014-15) (Base : 2007-08 = 100) 123·9
Wholesale Price Index Average (December 2016) (Base : 2004-05 = 100) 182·8
Consumer Price Index for Industrial Workers  (December 2016) Average (Base : 2001 = 100) 275
Consumer Price Index for agricultural labourers (December 2016) 876
Consumer Price Index for Rural Labour  (December 2016) 881
Consumer Price Index (Base : 2012 = 100) Combined (December 2016) 130·4
Consumer Price Index (Base : 2012 = 100) Rural (December 2016) 132·8
Consumer Price Index (Base : 2012 = 100) Urban (December 2016) 127·6
Consumer Price Index based inflation Rate (December 2016) Combined 5·61%


Sixth Economic Census (2014)

Total Enterprises

Rural

Urban

5·847 crore

3·502 crore (59·9%)

2·345 crore (40·1%)

Top 5 states having maximum Enterprises (In Descending Order)

Uttar Pradesh

Maharashtra

West Bengal

Tamil Nadu

Andhra Pradesh

Number of Industries Reserved for Public sector 2
Atomic Energy (Production, separation or enrichment of special fissionable material and substances and operation of the facilities).  
Railway operations only : Private investment has been allowed in Railways for other construction, operation and maintenance.  
Number of Industries requiring Compulsory  License 4
Cigars and Cigarettes of tobacco and manufac-tured tobacco substitutes.  
Electronic Aerospace and defence equipments.  
Industrial Explosives including detonating fuses, safety fuses, gun-powder, nitrocellulose and matches.  
Specified Hazardous chemicals i.e.,  
Hydrocyanic Acid its derivatives  
Phosgene and its derivatives.  
Isocyanates and disocyanates of hydrocarbons.  
Micro, Small and Medium Enterprises (MSMEs) contribution in country’s GDP 37·5%
Main Food Crop of India Rice
India’s place in the World Production of  
Sugar and Sugarcane First
Milk First
Banana First
Jute First
Steel Third
Manufacturing Sixth
Fish Second
Rice Second
Fruits Second
State with Highest Production of  Wheat (2014-15) Uttar Pradesh
State with Highest Production of  Rice (2014-15) West Bengal
State with Highest Production of  Pulses (2014-15) Madhya Pradesh
State with Highest Production of Coarse Cereals (2014-15) Rajasthan
State with Highest Production of  Total Foodgrains (2014-15) Uttar Pradesh
State with Highest Production of total  Oilseeds (2014-15) Madhya Pradesh
State with Highest Production of  Sugarcane (2014-15) Uttar Pradesh
State with Highest Production of Cotton  (2014-15) Gujarat
State with Highest Production of Potato (2014-15) West Bengal
State with Highest Production of Onion (2014-15) Maharashtra
State with Highest Production of Jute and Mesta (2014-15) West Bengal
Krishi Vigyan Kendra (2014-15) 641
Agriculture Universities (2014-15) 70
Horticulture Crops 341

Indian Economy A Few Facts: At A Glance (NATIONAL INCOME ESTIMATES)

New Base Year 2011-12
Real GDP or GDP at  
Current Price  
2015-16 (Ist RE) Rupess-sym (1)136·75 lakh crore
2016-17 (IInd AE) ₹152·51 lakh crore
Gross Value Added at  
Basic Price (on Constant Prices 2011-12)  
2015-16 (Ist RE) ₹104·69 lakh crore
2016-17 (IInd AE) ₹111·68 lakh crore
GDP at Constant Prices (2011-12)  
2015-16 (Ist RE) ₹113·57 lakh crore
2016-17 (IInd AE) ₹121·65 lakh crore
GNI at Constant Price (2011-12)  
2015-16 (Ist RE) ₹112·22 lakh crore
2016-17 (IInd AE) ₹120·28 lakh crore
NNI at Constant Price (2011-12)  
2015-16 (Ist RE) ₹99·46 lakh crore
2016-17 (IInd AE) ₹106·66 lakh crore
Per Capita Income at Constant Price (2011-12)  
2015-16 (Ist RE) ₹77524
2016-17 (IInd AE) ₹82112
GNI at Current Price  
2015-16 (Ist RE) ₹135·15 lakh crore
2016-17 (IInd AE) ₹150·83 lakh crore
NNI at Current Price  
2015-16 (Ist RE) ₹120·83 lakh crore
2016-17 (IInd AE) ₹134·85 lakh crore
Per Capita Income at Current Prices  
2015-16 (Ist RE) ₹94178
2016-17 (IInd AE) ₹103818


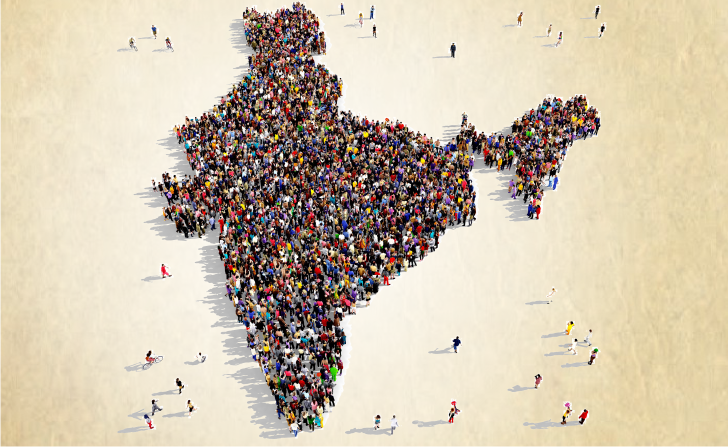
Indian Economy A Few Facts: At A Glance (POPULATION)

Total Population of the Country   (Census 2011) 121·0854 crore
Decadal Growth Rate (2001–11) 17·7%
Rural Population Growth 12·3%
Urban Population Growth 31·8%
Percentage of World Population (2011) 17·5%
Total Rural Population (2011) 83·37 crore
Total Urban Population (2011) 37·71 crore
Rural-Urban Population Ratio (2011) 68·84 : 31·16
Sex Ratio (2011) (Female per thousand male) 943
Child Sex Ratio (2011) (0–6 years) 919
State with highest Female-Male Ratio (2011) Kerala (1084)
Labour Force (2009–13) World Bank 48·43 crore
Total workers (2011 census) 48·17 crore
Male 33·18 crore
Female 14·98 crore
Density of Population (2011) 382 per sq. km
Birth Rate (2016) 19·28 per thousand population
Death Rate (2016) 7·3 per thousand population
TFR per woman (2016) 2·45
Maternal Mortality Rate (Per 100000 live births) (2011–13) 167
Infant Mortality Rate (2014) 39 per thousand  live births
Rural 43
Urban 26
Males 37
Female 40
Child (0 – 5) Mortality Rate 2016 (Per 1000 Children) 54·46


CENSUS 2011

Figures At a Glance–India

Population Persons 1210·8 million 100·00
  Rural 833·7 million 68·8
  Urban 377·1 million 31·2
Decadal Population Growth 2001–11   Absolute Percentage growth rate
  Persons 18,19,89,496 17·7
  Males 99·97 million 12·3
  Females 99·99 million 31·8
Density  of  Population (per sq. km)   382  
Sex Ratio (Females per 1000 males)   943  

Population in the age group 0–6
 
Absolute
Percentage to total population
  Persons 164·5 million 13·6
  Rural 121·3 million 14·6
  Urban 43·2 million 11·5
Literacy rate Persons   73·0
  Males   80·9
  Females   64·6

(The census 2011 results of Mao-Masam, Paomata and Parul subdivisions of Senapati district of Manipur were with-held due to administrative reasons. The figure have now been finalized and declared by office of the registrar General of India on 07-01-2014. Above given census data is after the inclusion of the census of three subdivisions of Senapati District of Manipur.)

Life Expectancy (at the time of birth) (2010–14) 67·9 years
Male 66·4 years
Female 69·4 years
Literacy Rate (2011) 73·0 per cent
Male 80·9 per cent
Female (2016) 64·6 per cent
Literacy (2011)  
Rural Male 77·2%
Urban Male 88·8%
Rural Female 57·9%
Urban Female 79·1%
Religionwise Population (2011)  
Hindu population (%) 79·8%
Muslim population (%) 14·2%
Christian population (%) 2·3%
Sikh population (%) 1·7%


GVA Growth in Various Sectors of the Economy

(At Basic Prices 2011-12)

(in %)


Sector


2015-16

2016-17 IInd (AE)
1.   Agriculture Forestry and Fishing 0·8 4·4
2.   Mining and Quarying 12·3 1·3
3.   Manufacturing 10·6 7·7
4.   Electricity, Gas, Water Supply and Other Utility Services 5·1 6·6
5.   Construction 2·8 3·1
6.   Trade, Hotel Transport, Commu-nication 10·7 7·3
7.   Financial Real Estate and Profe-ssional Services 10·8 6·5
8.   Public Administration Defence and Other Services 6·9 11·2
GVA at Basic Prices 7·8 6·7


Growth Rates

(At Constant Prices)

(in %)

  2015-16 2016-17

IInd AD Es

1. GDP 7·9 7·2
2. NDP 8·0 7·2
3. GVA at Basic Prices 7·8 6·7
4. GNI 7·9 7·2
5. NNI 8·0 7·2
6. Per Capita Income 6·6 5·9


Population Growth % (2001–11)  
Hindu 16·8%
Muslim 24·6%
Christian 15·5%
Sikh 8·4%
Religionwise Sex-ratio (2011)  
Hindu 939/1000 males
Muslims 951/1000 males
State having maximum Muslim population Assam

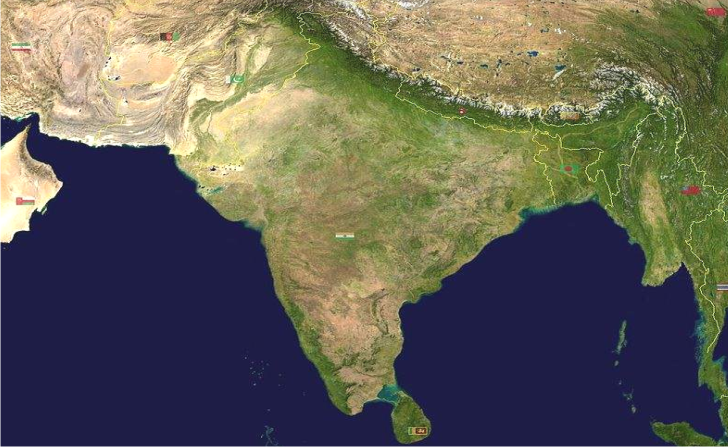
Indian Economy A Few Facts: At A Glance (GEOGRAPHY)

Total Area of the Country 3287263 sq. km
Reporting Area for Land Utilisation Statistics 307·796 million hectare
Length of Coast line 7517 km
Exclusive Economic Zone 2·02 million sq. km
Continental Shelf Area 0·53 million sq. km
Percentage of World Area 2·42 per cent (7th Place)
Forest & Tree Cover Area 794245 sq. km (24·16% of the total area)
Total Forest Cover Area (Including 4662 km2 area under mangroves) 701673 sq. km (21·34% of the total geographical area)
Agricultural Land/Cultivable Land (2013-14) 181·85 million hectare
Cultivated Land (2013-14) 155·58 million hectare
Net Area sown (2013-14) 141·43 million hectare
Per Capita Agricultural Land (2013-14) 0·145 hectare
Gross Irrigated Area (2013-14) 95·77 million hectare (47·7% of total cropped area)
Rainfed Area as % of net  sown area (2013-14) 52·3%
Largest State (Areawise) Rajasthan
Smallest State (Areawise) Goa
State touching boundaries of maximum states  
Uttar Pradesh (Touches boundaries of 8 states–Uttarakhand, Himachal Pradesh, Haryana, Rajasthan, M.P., Chhattisgarh, Jharkhand and Bihar)  
Area under foodgrains (2014-15) 124·299 million hectare (87·89% of net sown area)


Pakistan’s Former NSA Admits 26/11 Mumbai Terror Attacks were By Pakistan Based Terror Groups & Mastermind Hafiz Saeed

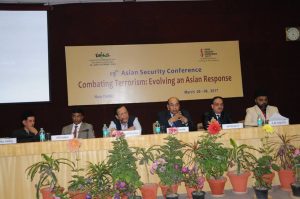
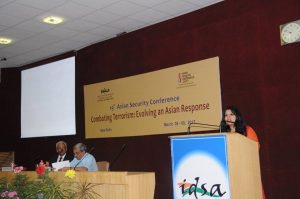
Inaugurating the 19th Asian Security Conference (ASC), India’s Defence Minister, Manohar Parrikar stated on March 6, 2017; that terrorism remains the most pervasive and serious challenge to global security and while threat of terror is transnational but the response to this threat is generally local and uncoordinated, largely due to conflicting definitions of terrorism and geopolitical constraints, which have stymied a global response. He added that successful combat against terrorism requires a holistic approach and elaborated that tackling of terror finance and countering the misuse of the internet through social media by terrorist entities are important steps in this process. He exhorted Asian countries for collective action against terror.

ASC organized annually by Institute for Defence Studies and Analyses (IDSA), New Delhi, since 1999; has emerged as an important platform for debating issues relating to Asian Security and has been providing a forum for security analysts, practitioners and policy makers from around the world to share their views on the challenges facing the Asian continent.

The 19th ASC is being held on the topic “Combating Terrorism: Evolving an Asian Response”, and the conceptual background is resurgence of violent extremist movements that have evolved in sophistication with the advances in technology, communication, and the complicated web of terror finance. While the challenges confronting Asia and the global order have multiplied, a cohesive response to them has remained elusive. With countries in the region constructing frameworks of cooperation to combat terrorism, it is time to exchange ideas on countering violent extremism, which will define an Asian approach to this issue. A global regime built on a strong foundation of effective regional practices is bound to find wider acceptability. The conference was expected to explore these subjects through the course of the following interactive sessions:

  • Norms & The Global War on Terror : Challenges for Asia
  • New Wave of Global Terror : Ideas, Resources and Trends
  • The Age of ‘Instant Terror’: Technology, the Game Changer
  • Regional Perspectives – The West Asia Conundrum : Unraveling geopolitics & global response
  • Regional Perspectives – South and South East Asia : The Growing Spectre of Terror
  • Constructing effective counter-narratives: The need for a global response
  • The Asian Response to Combating Terror : The Way Forward

In his keynote address, National Security Advisor of Afghanistan, Mhd. Hanif Atmar, called for the need for strong counter-terrorism strategy, with proposed actions at Global, Islamic World, Regional and National levels; and described Security and Counter Terrorism as the ‘most defining challenge of our times’. He called for long-term planning with the objective to end State sponsorship of terrorism by initiating coordinated political, strategic and military responses to destroy the flourishing sanctuaries for terrorist groups. He added that Afghanistan is confronted with a terrorist war, and an undeclared State to State war. He also dispelled the perception of terrorism being associated with Islam as unethical and unhelpful, insisting that the Muslim nations have lost more lives to extremism and terrorism than other nations and added that the Muslim nations are natural allies in the war against terrorism. Blaming Pakistan for exporting terror, Afghanistan said some nations must be designated as ‘terrorist states’ failing which at least ‘individuals’ must be designated as ‘terrorists’ to combat terror more effectively.

During the conference Pakistan’s former National Security Advisor, Mahmud Ali Durrani admitted that  the 26/11 Mumbai terror attack that claimed 166 lives in 2008, were carried out by terror groups based in Pakistan and said Pakistani terrorist Hafiz Saeed, accused of carrying out the deadly strikes, should be severely punished. But he has at the same time denied any role of government of Pakistan or the Inter-Services Intelligence (ISI) in that attack.

India’s Defence Minister Manohar Parrikar reiterated that though there is a broad consensus on what constitutes an act of terror, a formal agreement is missing and expected that Asian initiative will put greater pressure on the rest of world. Parrikar said that India had submitted a proposal for Comprehensive Convention on International Terrorism (CCIT) at the United Nations General Assembly in 1996 and ‘twenty years later we continue to push and put our weight behind this aspect to shut down terror camps, ban all terror groups, and make cross border terror an extraditable offence’ and once again called for early adoption of India-backed CCIT by the UN.

1 2

Supreme Court Rules that Answer Sheets and Interview Marks Sheets can be Disclosed, but not Examiner Names

Reiterating its earlier stand, the Supreme Court held that citizens have a right to access their evaluated answer sheets and interview marks sheets. But the Court also made it clear that the identity of the examiners cannot be disclosed and that such disclosure will lead to confusion and public unrest.

 In CBSE Vs Aditya Bandopadhyay case, the Supreme Court (SC) had in 2011 made it clear that every examinee (candidate) will have the right to access his evaluated answer-books, by either inspecting them or taking certified copies. The Supreme Court once reiterated that every candidate has the right to get a copy of his answer sheet and interview marks sheet. While disposing an appeal filed by the Kerala Public Service Commission, the Supreme Court also made it clear that the names of the examiners cannot be disclosed.

The Supreme Court was reviewing a decision of the Kerala High Court & Allahabad High Court where in the high courts ruled that candidates are entitled not only to get their scanned copies of the  answer sheet and interview marks but also the names of the examiners who have evaluated the answer sheet. The SC made it clear that the public authority does not keep the answer sheets and interview evaluation sheets in a fiduciary capacity. The SC said that disclosing the marks and the answer sheets to the candidates will ensure that the candidates have been given marks according to their performance in the exam. The SC went on to say that such practice of disclosing answer sheets and interview evaluation sheets will ensure a fair play in this competitive environment, where candidate puts his time in preparing for the competitive exams.